
I wanted an app I could open, type a weight, type a rep count, and close. Three taps. That was the brief.
Most workout trackers want more from you. Before they'll let you log a single set, they want to know — are you cutting or bulking? Beginner, intermediate, advanced? How many days a week? What's your goal weight by summer?
Then the home screen drops you into a feed: your friends are working out, you're on a 4-day streak, the December challenge ends in 11 days. Then a chat box with an AI coach offering to analyze your squat depth.
I just wanted to type 60kg × 5. And, eventually, a chart that would tell me whether the number was going up.
So I started building.
Make logging the easy part.
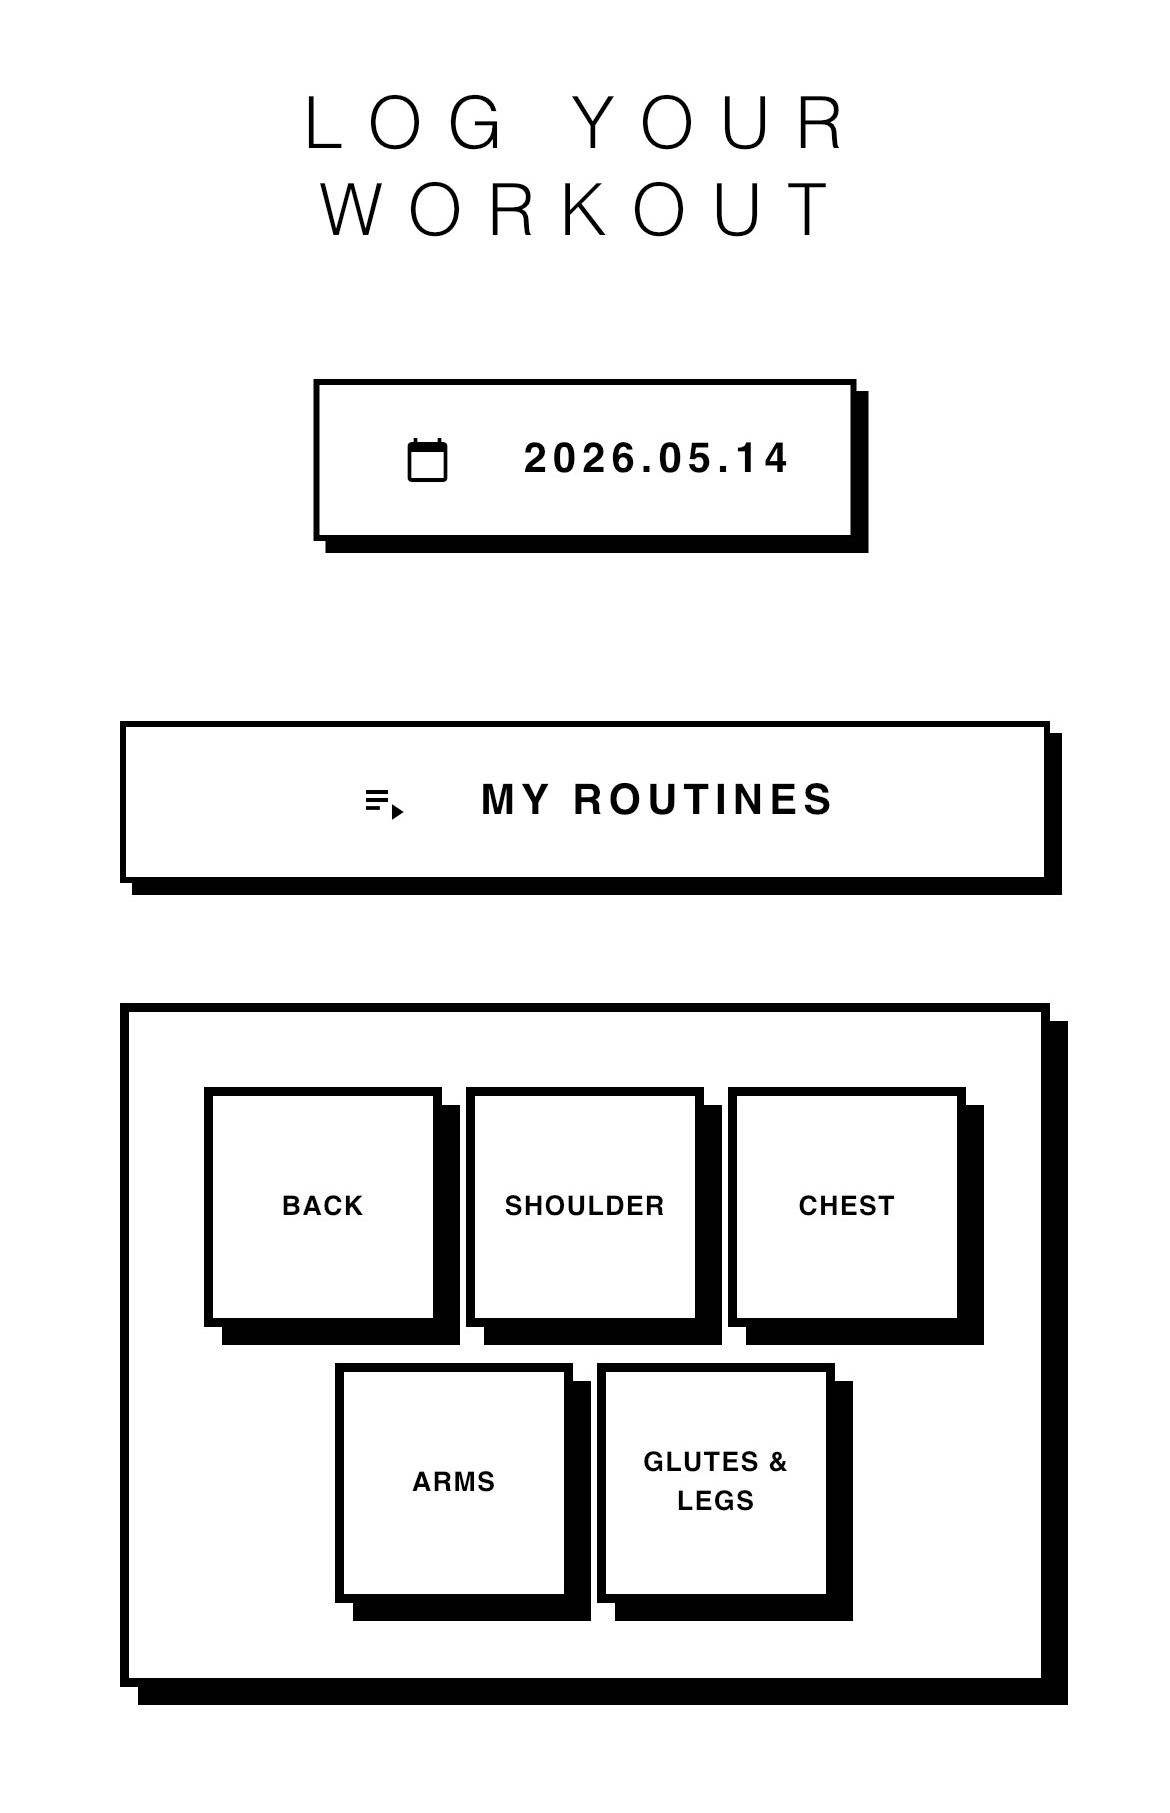
Things I didn't build, in roughly the order I was tempted: a social feed, a friend graph, weekly streaks, monthly challenges, badges for personal records, push notifications nudging me back into the app, an AI coach analyzing my squat depth. Most product decisions in Trackup are decisions to not add something.
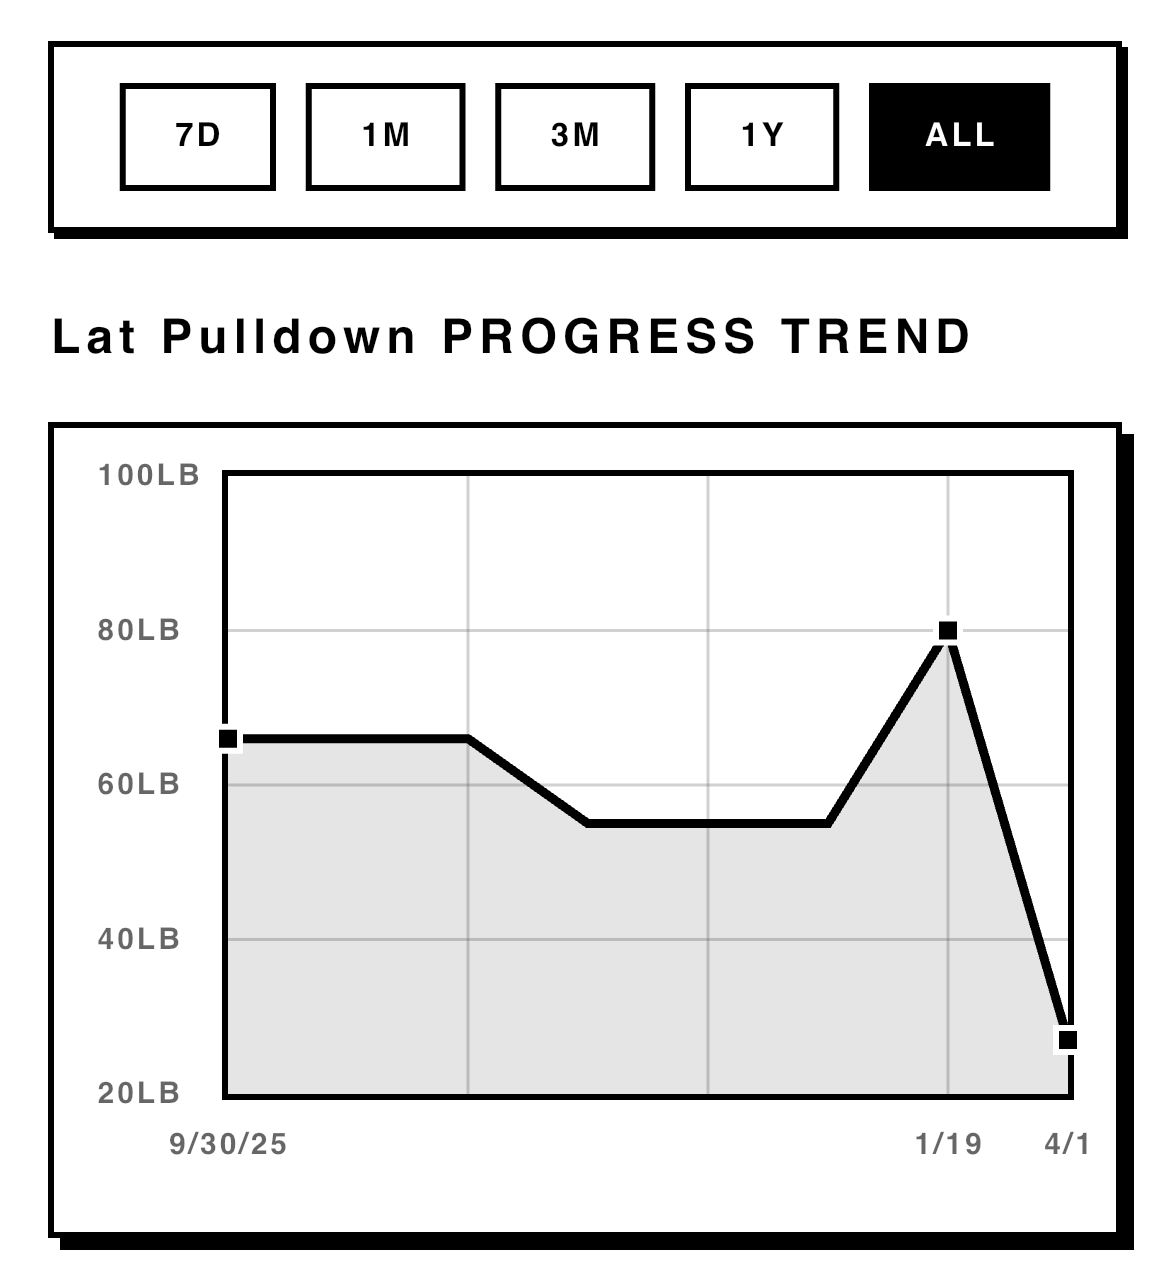
The Trends page shows one number — the weight you moved for a given exercise — plotted over time. No calories burned. No heart rate zones. No activity rings. No "fitness score." Progressive overload is the only variable that decides whether you build muscle. So that's what the chart shows. Whether the line is going up.
Log by talking.
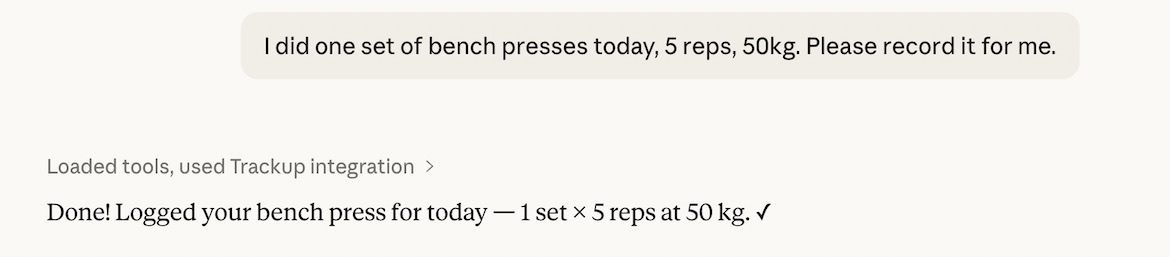
A few months after launch, I added an MCP server to Trackup. MCP — Model Context Protocol — lets an AI model read and write to an app's data without going through the app's UI. The work took about an hour. The result was that I could open Claude on my phone, say "I did 5 reps of bench press at 50kg today," and the set would land in Trackup. No app. No tap.
Logging a set used to take seven taps inside the app — muscle group, exercise, weight field, weight value, reps field, reps value, save. Now it takes one sentence. The interesting part isn't the tap count. It's that the app is no longer the only way in.
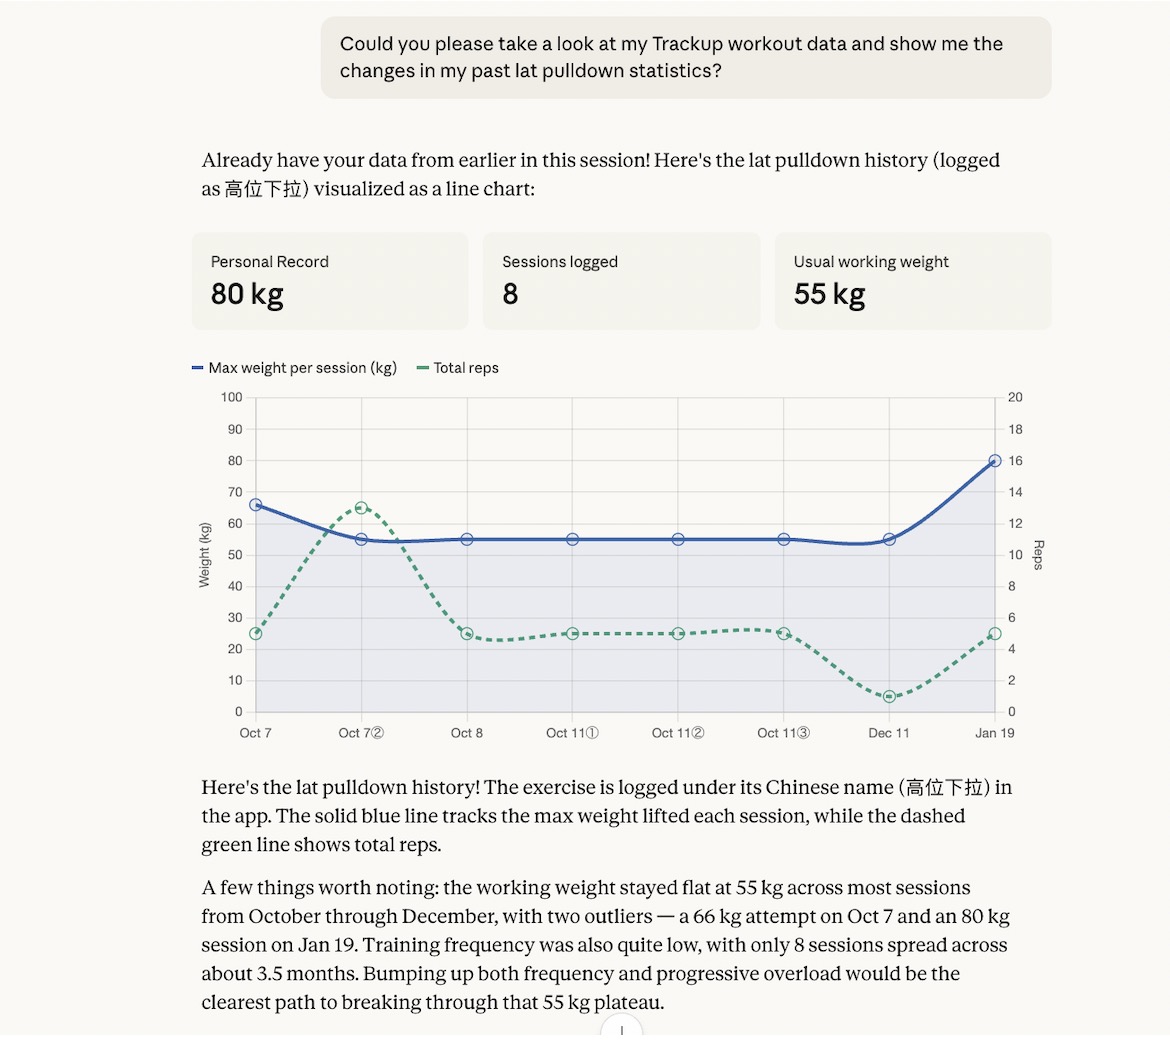
The same thing happens going the other way. I ask Claude "show me my lat pulldown progression this year" and it pulls the data, draws a chart, points out where I plateaued, suggests where to push. Charts on demand, on my data, in plain English.
Want to try it? Connect Trackup to Claude — five minutes, one URL.